Thermo Fisher Scientific – Analytics
Delivering campaign insights, efficiency, and automation to several divisions at Thermo Fisher Scientific.

Situation
Banking on its almost ten-year partnership with our company, global science leader Thermo Fisher Scientific approached Transiris to develop marketing business intelligence capabilities for several divisions such as Lab Chemicals (LCD), Material Science (MSD), and Pharma Services Group (PSG).
All these divisions relied on manual attribution, measurement, and reconciliation, with little use of automation. They were also grappling with unstructured data, siloed reporting systems, and misaligned processes, which needed to be transformed into a single, unified source of truth for all marketing KPIs.


Solution
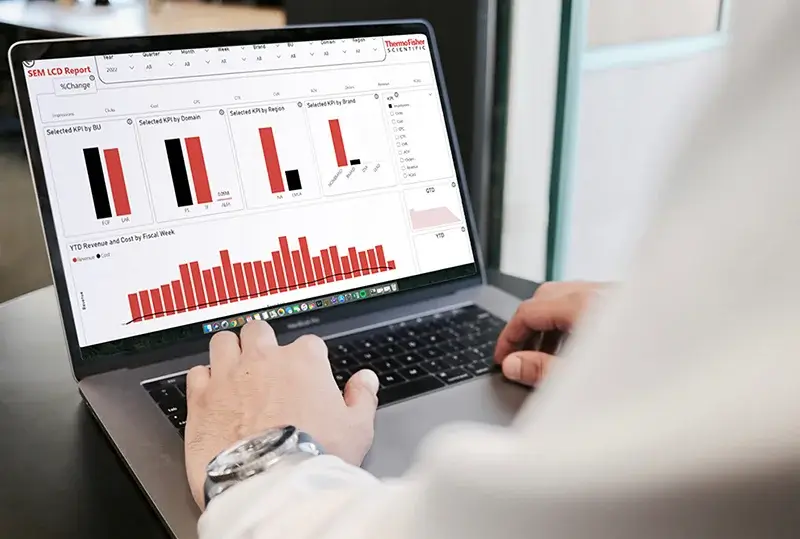
We used Power BI to acquire, structure, aggregate, and visualize the operational and performance data to provide marketing insights critical for decisions and for budget allocation processes. We connected the relevant channels including Adobe Analytics, Adobe Advertising Cloud, Salesforce, and corporate data warehouses and automated exports to achieve near real-time updating of the newly developed dashboards.
We built dashboards to cover Quote to Cash and Search Engine Marketing, providing marketing reps with the insights needed for optimizing performance across their marketing campaigns. We also created full-funnel marketing dashboards to aid key business decisions and assist in improving conversions. We brought together CRM systems into a single, clear view, audited and fully automated the reporting processes internally, and ensured consistency.
Outcomes
Thermo Fisher Scientific now has an overview of all the active marketing campaigns and respective results in real-time, with high accuracy, without the need for manual work. The dashboards empower stakeholders to make smarter, quicker, and more reliable marketing decisions.
The results speak for themselves. With a streamlined and standardized process, the individual Thermo Fisher groups and divisions enjoy an 80% reduction in the hours spent reporting data. With reports generated in near real-time, marketers can also react effectively to trends and market changes.
